4.Risk Management
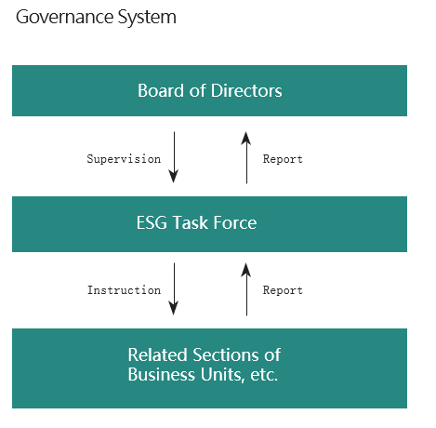
Wacom has established a Compliance Risk Committee, chaired by the Group CEO, to serve as our risk management framework. The managers of each department, including our overseas subsidiaries, are required to report to this committee in the event of realized risks or material changes in predicted risks.
The ESG Task Force identifies and evaluates risks related to climate change issues. For related risks with a significant potential impact on our company, the ESG Task Force shares information and collaborates with the Compliance Risk Committee to ensure appropriate management and supervision and minimize their potential impact on the Company. These activities are regularly reported to the Board of Directors by our Group CEO.
5.Metrics and Targets
As part of our efforts to combat to climate change, we support the Japan Climate Initiative (JCI). We have set and announced an intermediate target for CO2 emissions to be met by fiscal year 2030. We believe this intermediate target will be our share of contribution to the global goal to achieve carbon neutrality by 2050. So far, we have aimed to reduce CO2 emissions caused by our offices’ operation in Japan by 48% by 2030 compared to 2014 as the base year*1.
In April 2024, we set a new target covering our global emissions:
We will reduce Scope1-2 emissions by 80% and Scope3 emissions by 25% by 2030 compared to 2021 as the base year*2. This target is based on the 1.5˚C standard of the Science Based Target (SBT), which is scientifically aligned with the target set by the Paris agreement. We submitted an application to the SBT initiative (SBTi), an organization that approves SBT, on May 31, 2024.
*1 Following office relocation and extension completed in 2013, we set FY2014 as the base year.
*2 We newly set FY2021 as the base year when GHG scope1-2 data became available globally.
Activities to Reduce CO2 Emissions
The CO2 emissions in 2023 were largely reduced since we began utilizing Sai no Kuni Furusato Denki (renewable energy from post-FIT sources) at our head office in Saitama Prefecture from November 8, 2022.
The increased electricity usage in 2023 was due to the increased number of team members working at each office. For our CO2 emissions trend for fiscal years 2021 to 2023, please see the graph below. Moving forward, we will explore feasible measures including the expansion of renewable energy use to achieve CO2 emissions reduction target.
Electricity consumption
GHG emissions Scope1-2
• Scope1 is calculated from the gasoline consumption of company cars and LPG consumption for the company cafeteria kitchen at the head office.
• Scope2 is calculated from the electricity consumption of each office, the emission factor of each power company or country of the year, and the calculation method of each country.
• The CO2 emissions in 2023 were largely reduced since we began utilizing Sai no Kuni Furusato Denki (renewable energy from post-FIT sources) at our head office in Saitama Prefecture from November 8, 2022.
• Some medium-sized offices with several dozen staff members in Bulgaria (Sofia) and Korea (Seoul) cannot provide CO2 emissions data because of administrative rules of the buildings they lease.
• In Germany, Dusseldorf office purchases electricity with zero emission factors, and their CO2 emissions are regarded as zero. This makes Germany’s total CO2 emissions smaller than the one of U.S., which has almost same-sized office as Germany.
• Scope1 was recalculated by adding CO2 emissions from the gasoline consumption of company cars in overseas offices. (September 2024)
GHG emissions Scope3
Category
|
CO2 emissions(t-CO2)
|
2021 |
2022 |
2023 |
1. Purchased goods and services
|
263,951 |
271,626 |
234,466 |
2. Capital goods
|
4,919 |
6,764 |
6,157 |
3. Fuel-and-energy-related activities (not included in Scope 1 or 2)
|
208 |
217 |
231 |
4. Upstream transportation and distribution
|
2,115 |
1,466 |
1,391 |
5. Waste generated in operations
|
7* |
11* |
6* |
6. Business travel
|
615 |
1,104 |
1,617 |
7. Employee commuting
|
2,008 |
1,850 |
1,430 |
8. Upstream leased assets
|
- |
- |
- |
9. Downstream transportation and distribution
|
- |
- |
- |
10. Processing of sold products
|
- |
- |
- |
11. Use of sold products
|
25,476 |
19,094 |
15,000 |
12. End of life treatment of sold products
|
240 |
160 |
119 |
13. Downstream leased assets
|
- |
- |
- |
14. Franchises
|
- |
- |
- |
15. Investments
|
- |
- |
- |
• The result of “5. Waste generated in operations” includes data from offices in Japan only.
• Scope3 data for 2023 was added. (September 2024)
• Figures of Category 1,2,3,5, and 6 for 2021 and 2022 were corrected since there were calculation errors. (September 2024)
[back to top]